Learning Levels in Blind School Students
Baseline assessments for lbind and sighted students in public schools
Objective
Having worked closely with several blind schools in India, we found the need for a study probing the specifics in educational needs of blind children that are not being met by the Indian education system. WE consulted with the team that publishes ACER report at Pratham Foundation to understand how we could go about finding answer and created this assessment model for the same.
Outline
According to the 2011 Census, only 61% of India’s disabled population in the age group of 5-19 years attends an educational institution. The National Policy for People with Disabilities(2006) intends to ensure that every child with a disability has access to appropriate pre-school, primary and secondary level education by 2020. With one more year to the deadline, and the number of children with disabilities attending schools slowly going up, how do we analyse the quality of education they receive. Students with visual impairments face many detractors in their learning environment which can have a cumulative impact on the learning achievement of visually impaired students. The objective of this paper is to evaluate the learning achievement of students who have completed primary education in India, viz. Fifth grade, with and without visual impairments through a baseline assessment. The paper reveals the need for a tactile, spatial approach to learning with a focus on auditory learning along with prioritising the improvement of Braille fluency and developing new tools for Mathematics learning.
Test Design
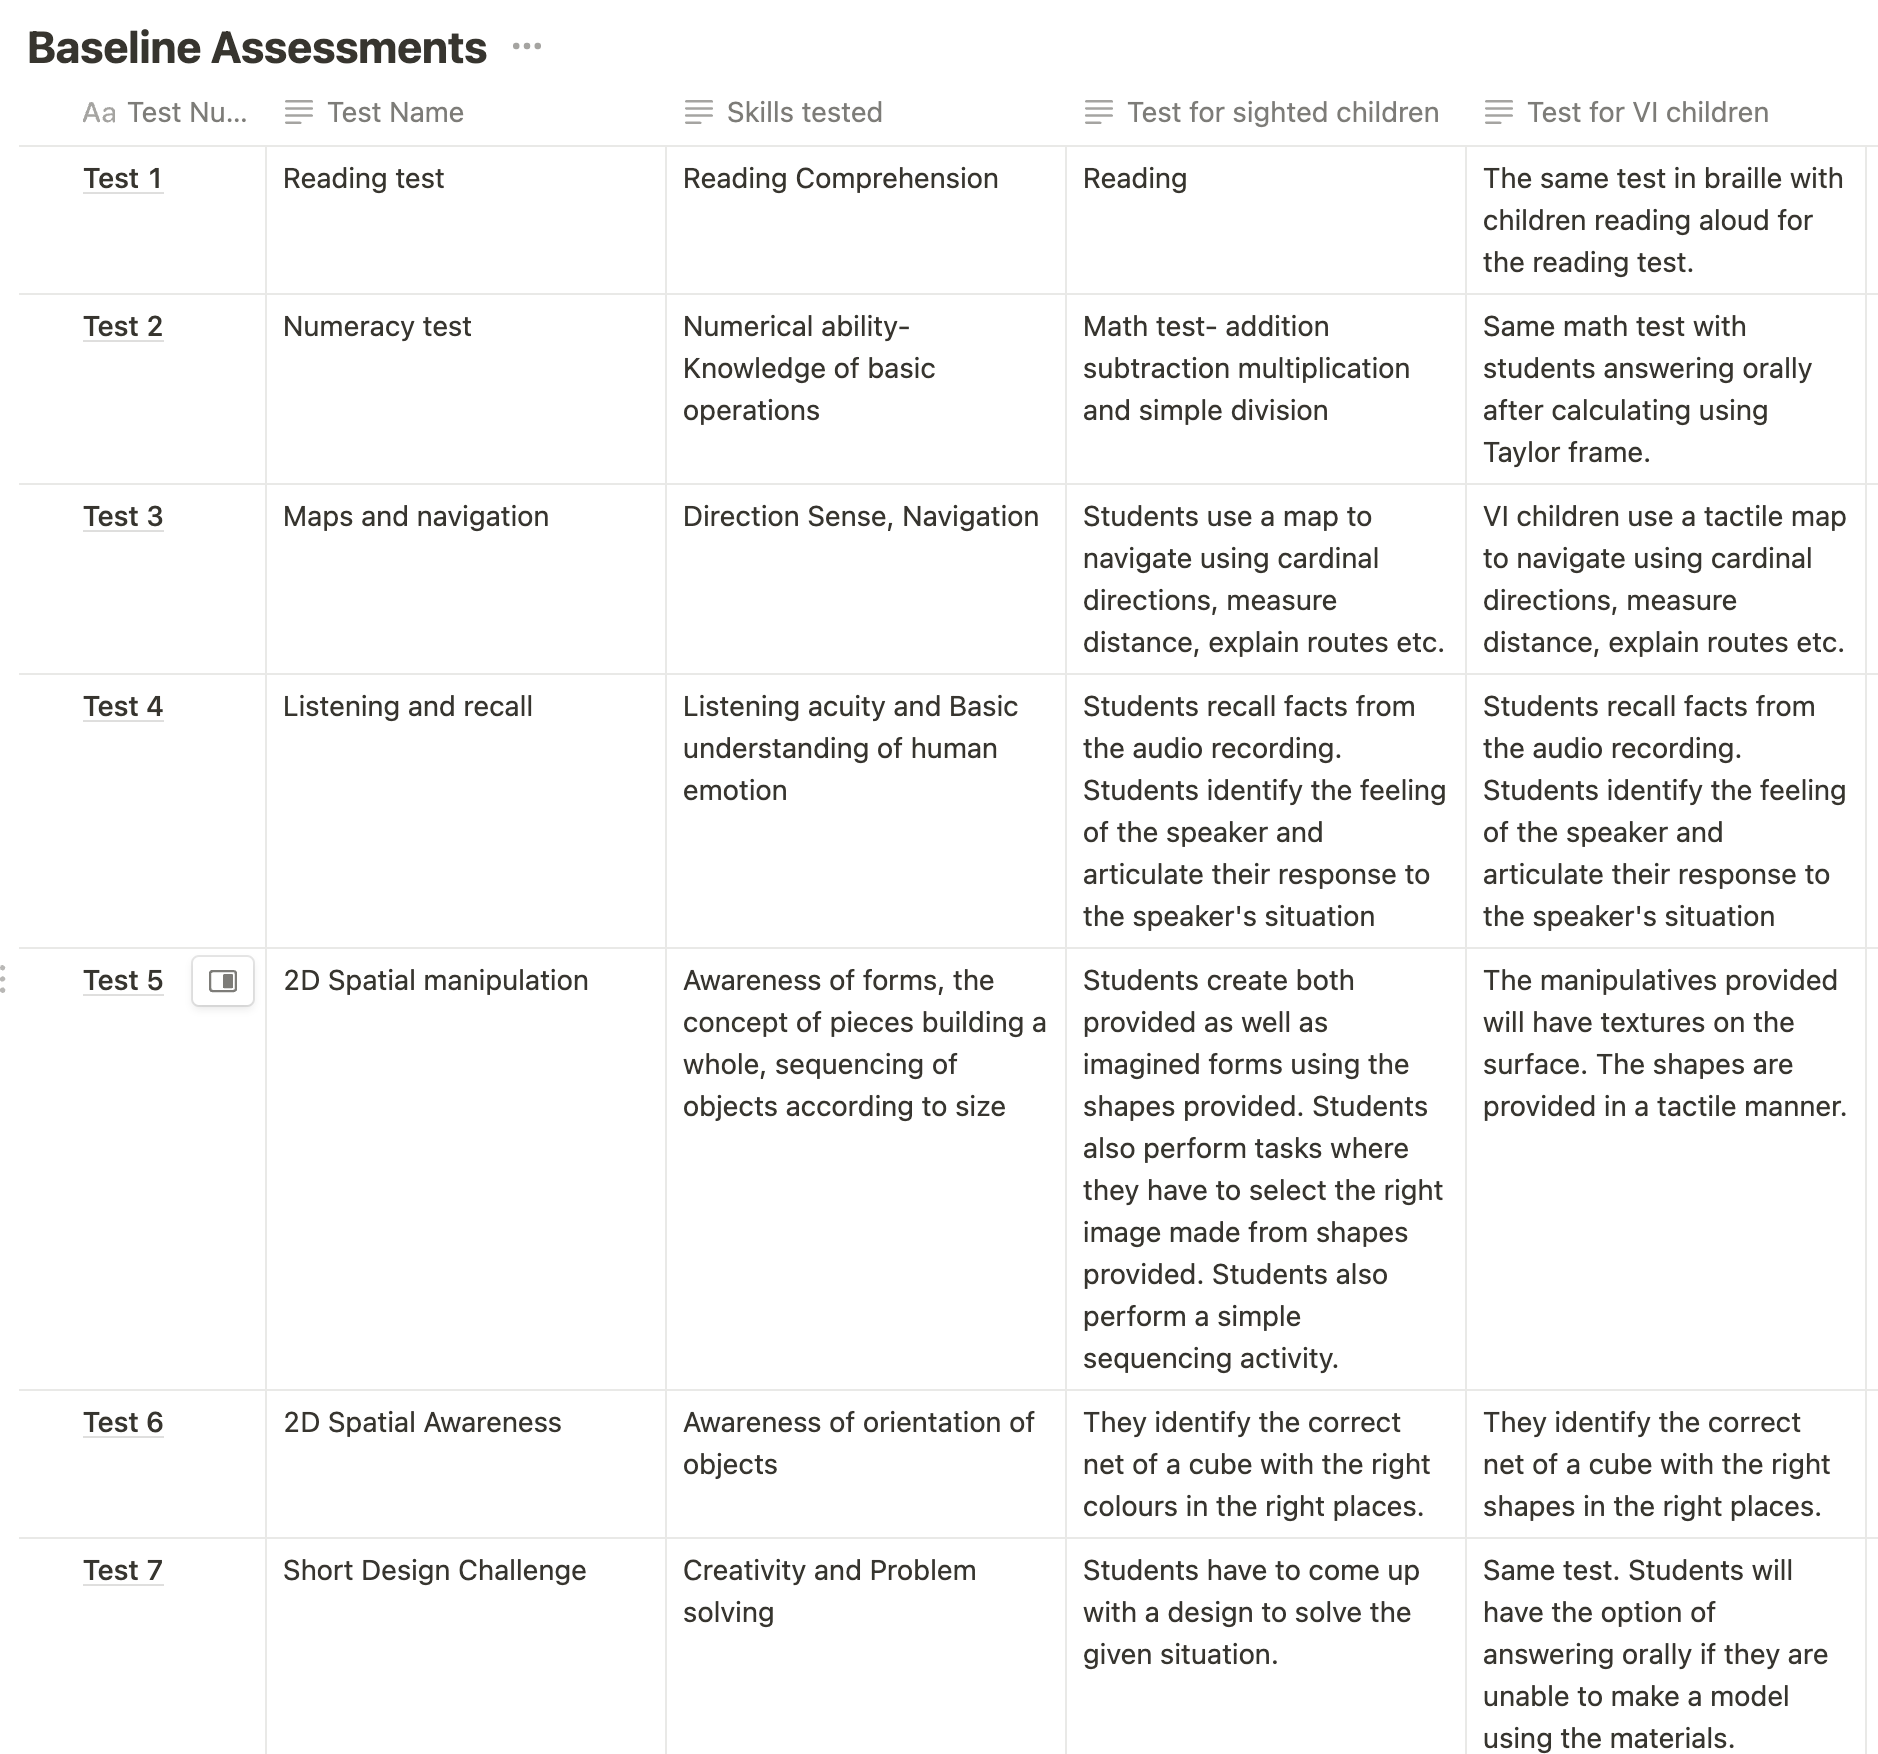
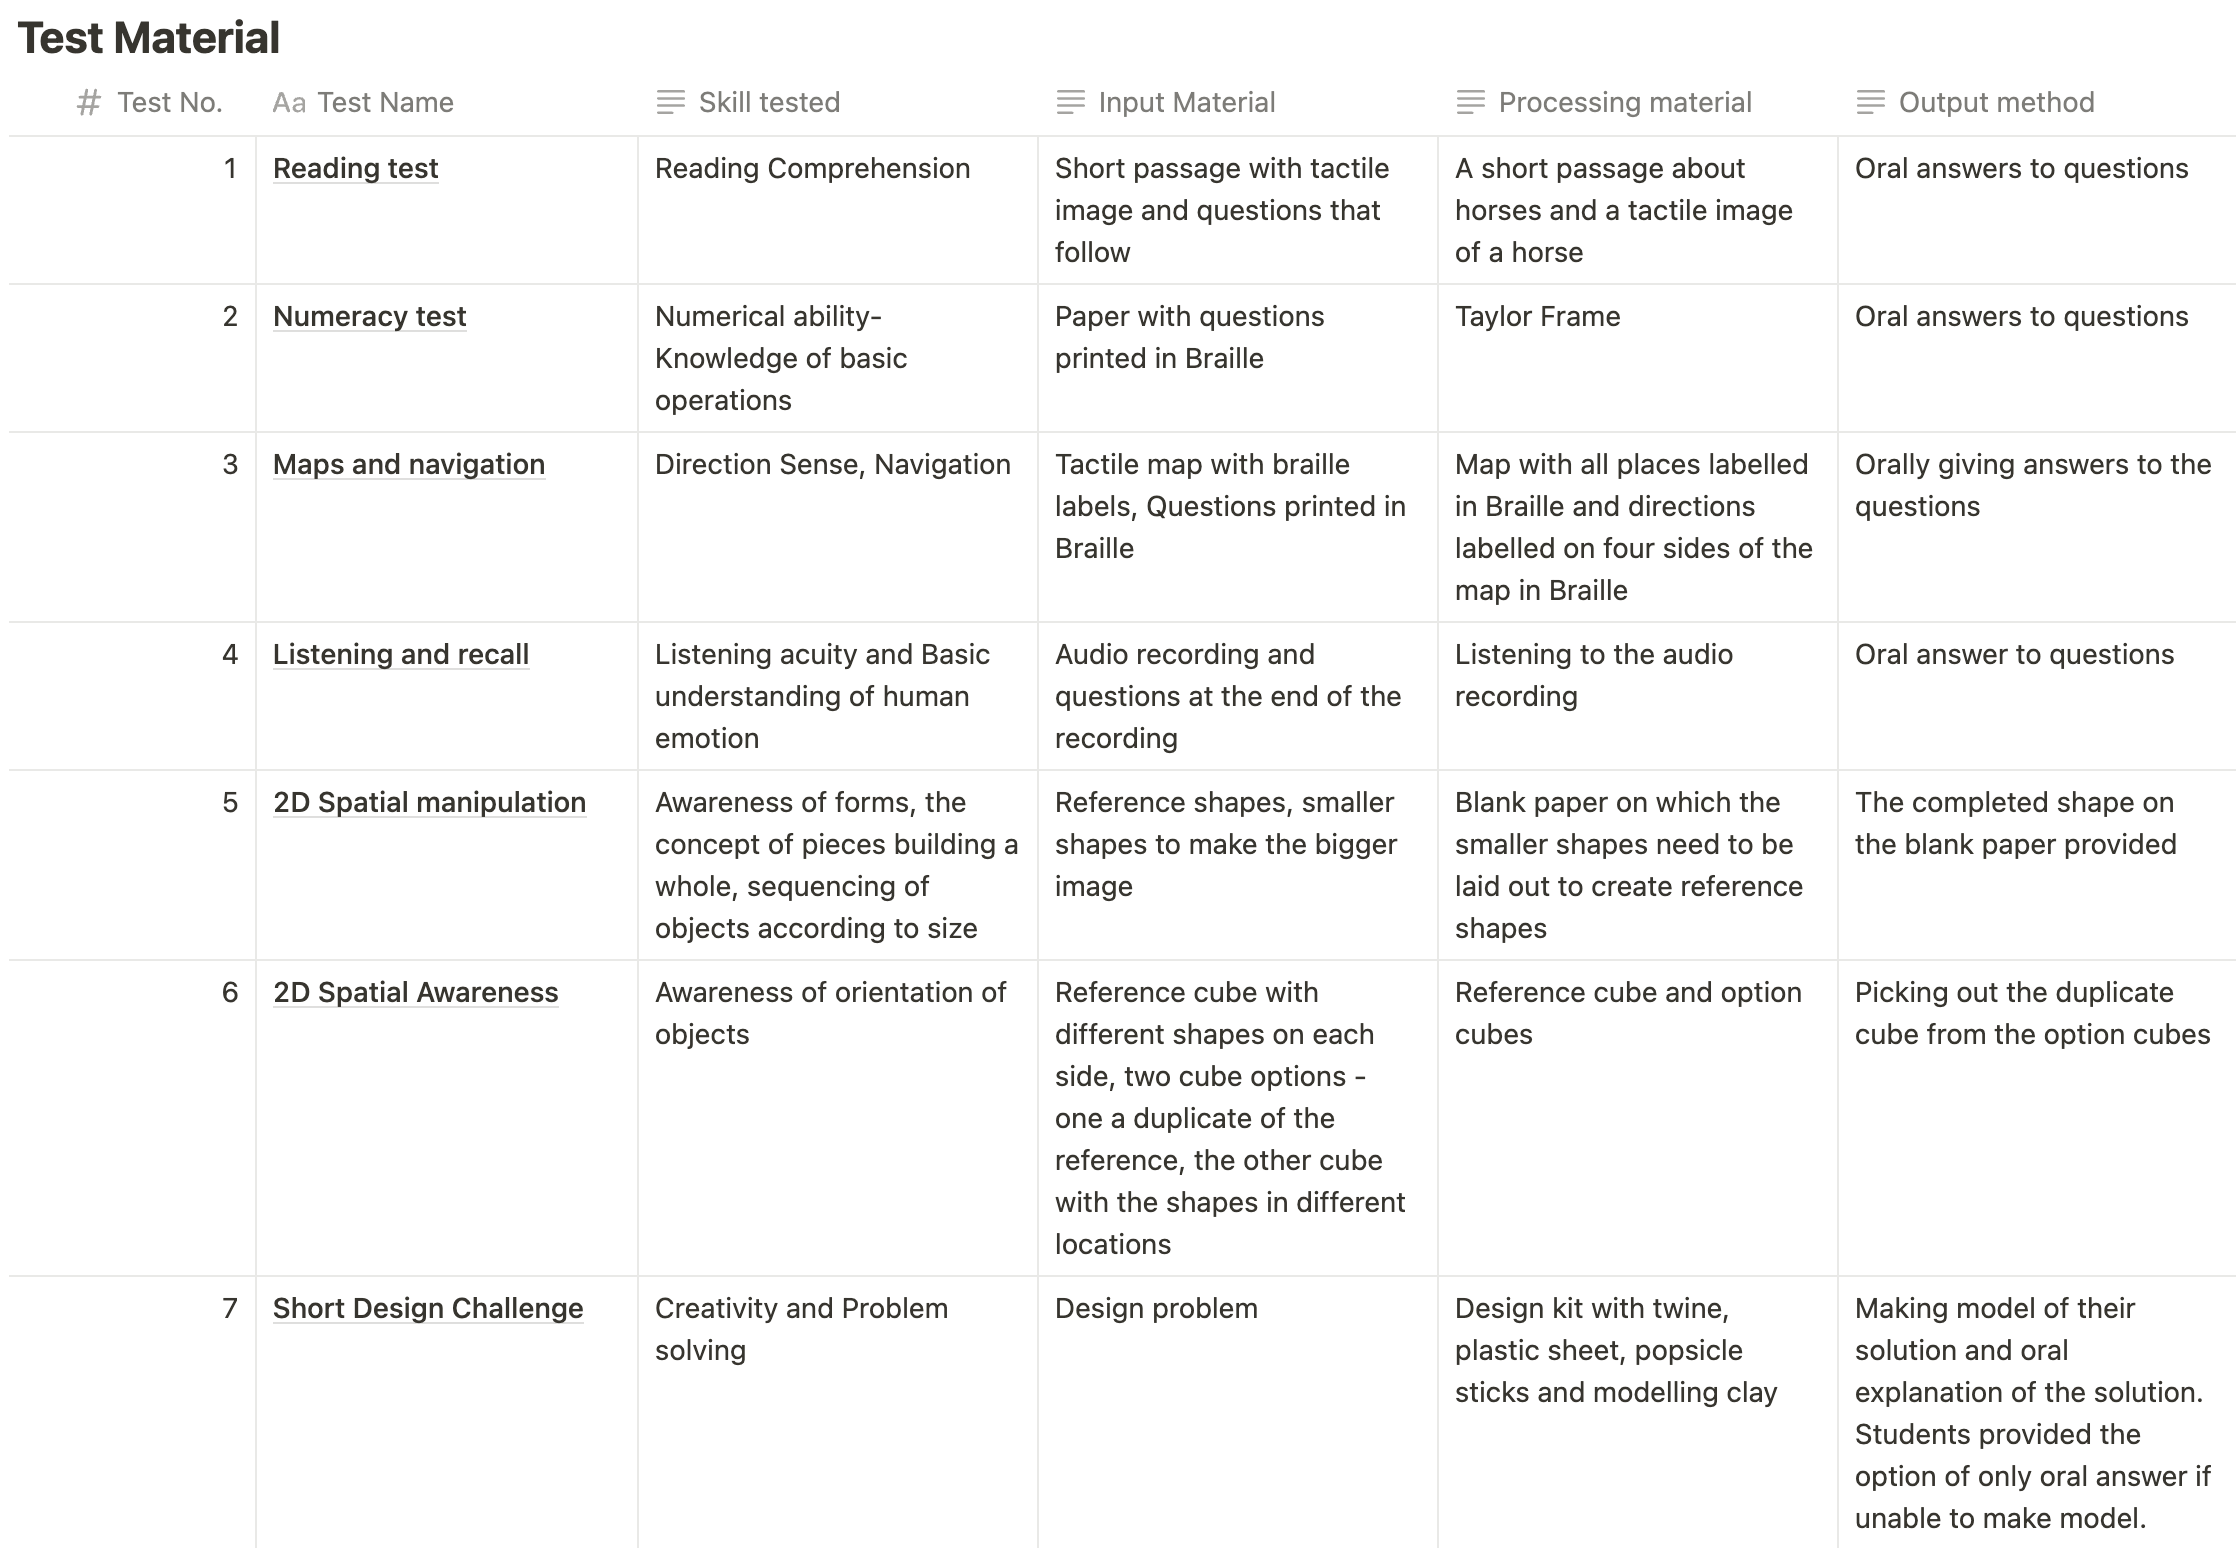
In order to ensure that the tests were fair to students with visual impairment, the test material was created in traditional print form as well as adapted to tactile material, braille, and Taylor frame, etc. The methods were reviewed by four completely blind individuals of which two were students and one a special educator in a blind school. The reviews helped to incorporate necessary accommodations. The test was also reviewed with two sighted special educators in a blind school.
Participants
Study 1
The participants in this study were 10 students who have completed grade 5. 4 of the students were partially blind and 6 of the students were completely blind. The students were in the age group of 11 to 14. The participants came from two blind schools- 5 from a blind school in Bangalore and 5 from a blind school in Trivandrum.
Study 2
The participants in this study were 15 students who have completed grade 5 and entered grade 6 a month before the test happened. All of the students were sighted and were in the age group of 11 to 13. All the participants attended a mainstream private school in Bangalore city.
Discussion
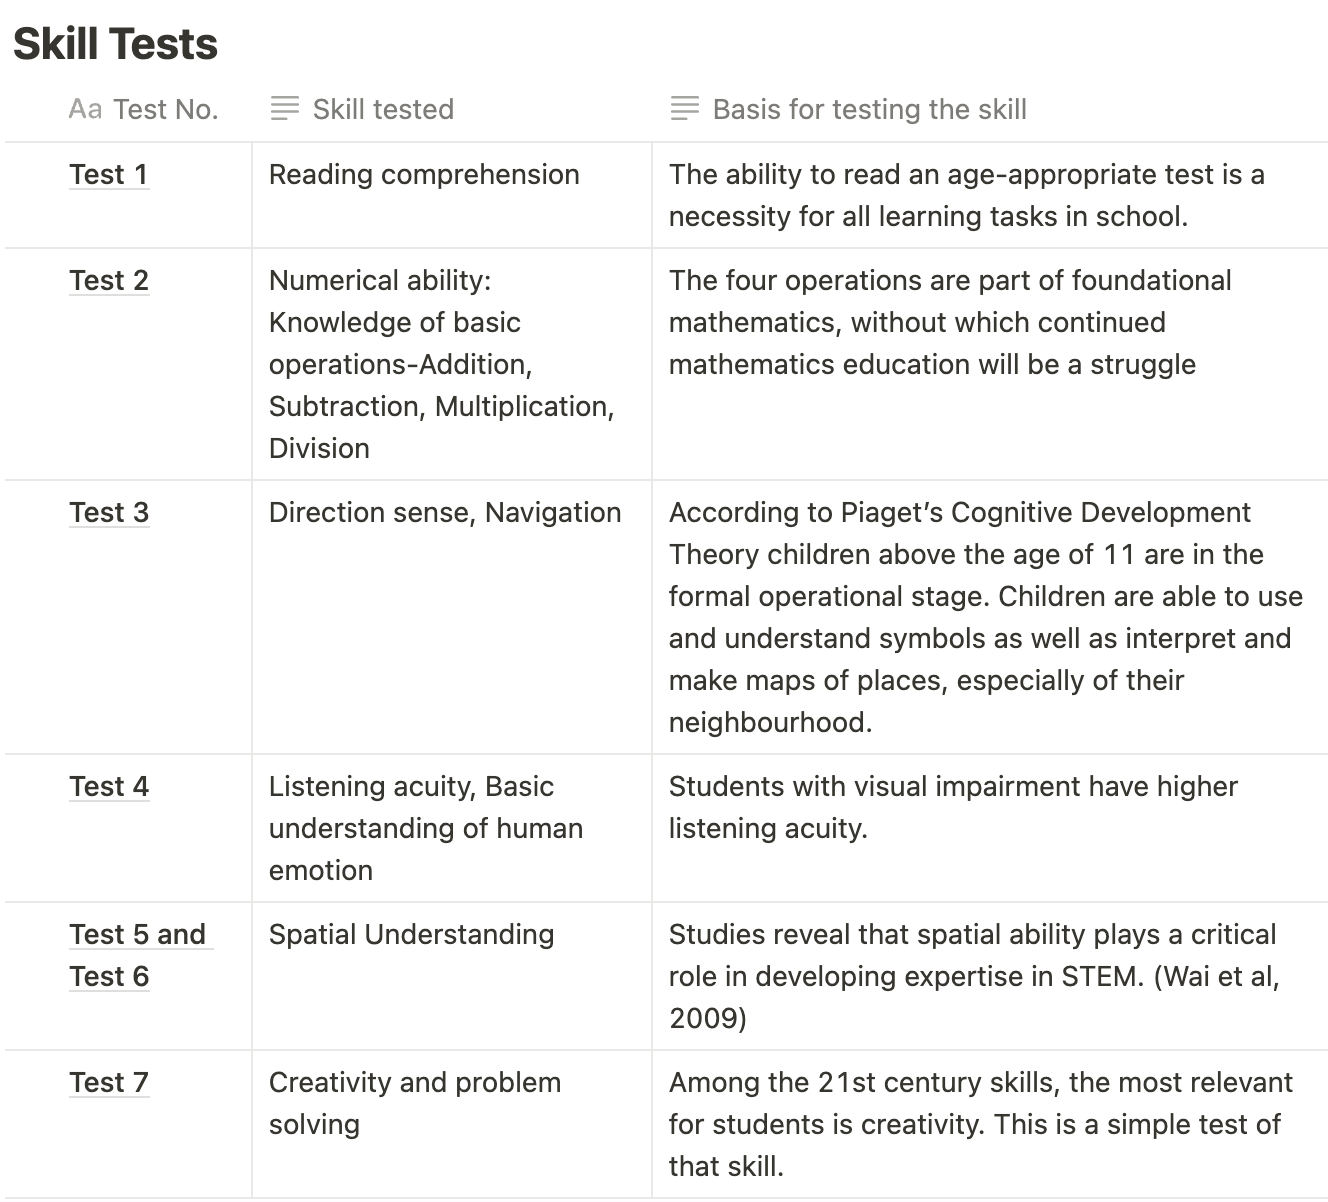
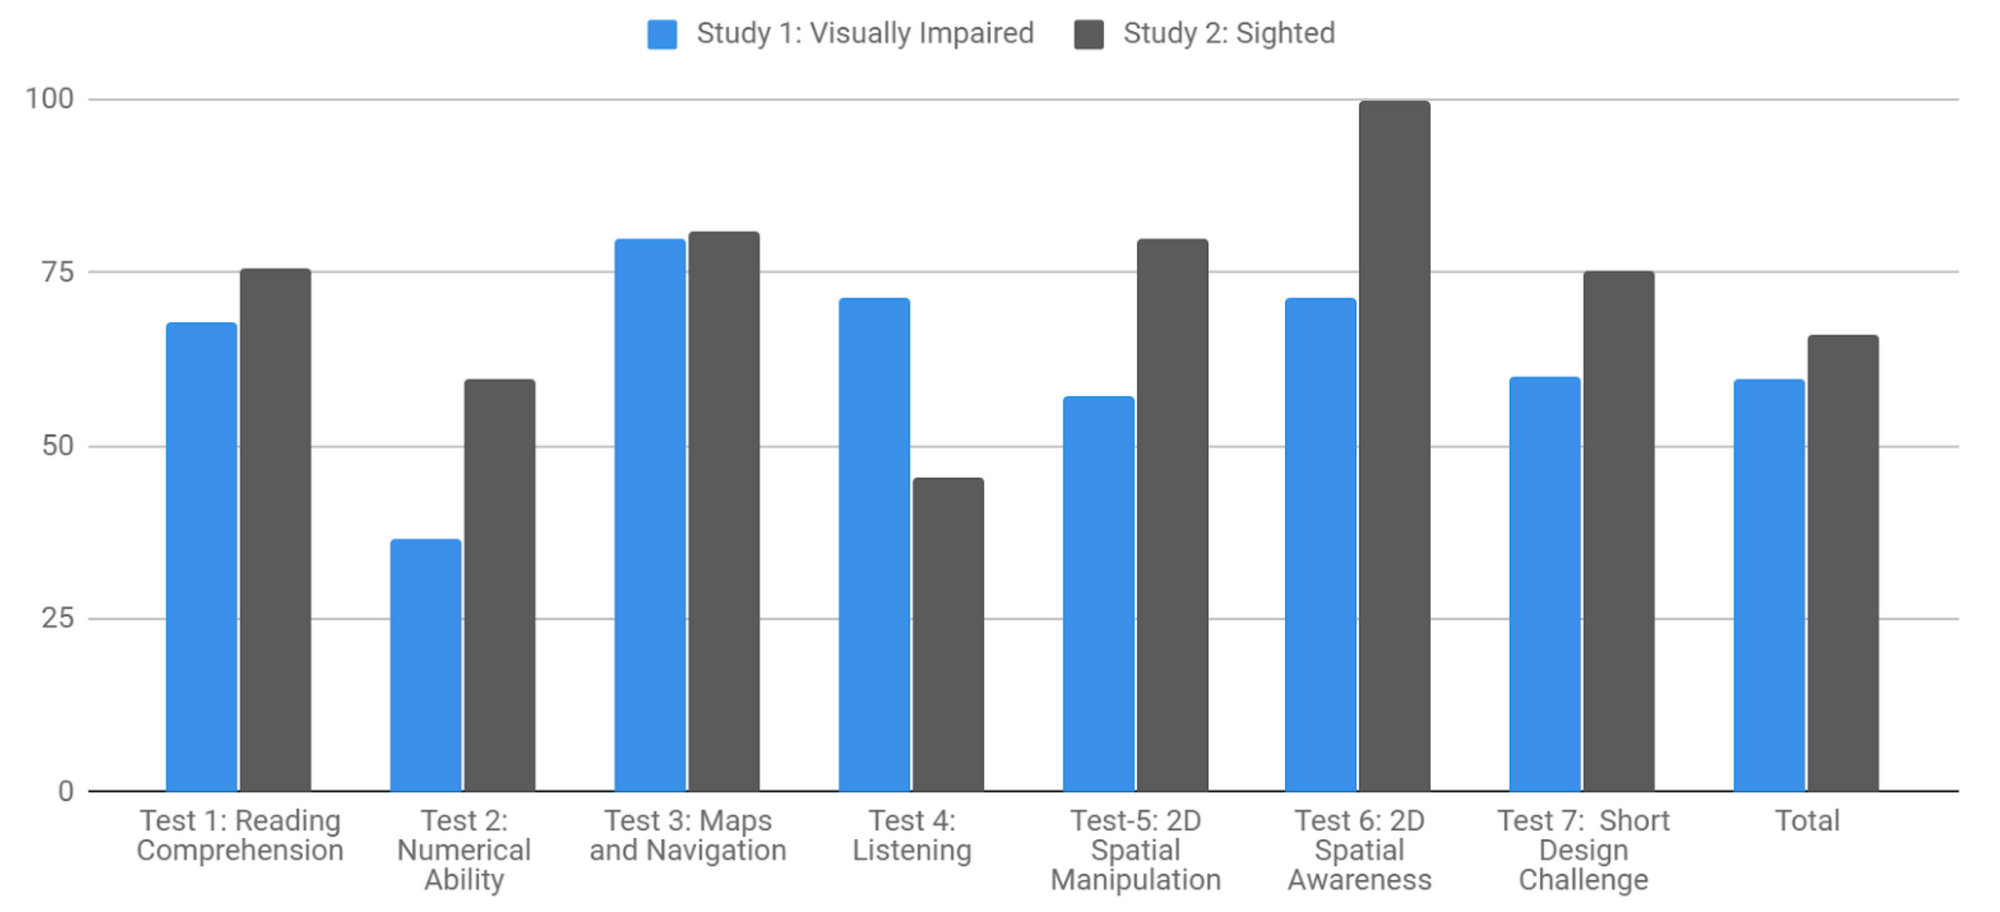
Test 1: Reading Comprehension
Visually impaired students and sighted students scored an average percentage of 67.85 and 75.82 respectively, showing small variation(8%) in the results. This was due to a comparable challenge that both groups experienced in comprehending English. Both sighted and visually impaired students who had good reading fluency faced difficulty with comprehending the language.
Test 2: Numerical Ability
There was a higher variation(~23%) in the average percentages of the scores of the students. This had to do more with the way the questions were processed by students with visual impairment. They had to first read the question in braille, then replicate it on their Taylor Frame before solving it. This step caused errors. However visually impaired students simply had to solve the problem on the question paper itself.
Test 3: Maps and Navigation
In the maps and navigation test both groups performed comparably. This is evidence of the usefulness of tactile maps and symbols in teaching students with Visual Impairment about directions and navigation.
Test 4: Listening Test
Visually impaired students fared much better, 71.42% average percentage of visually impaired students compared to 45.6% average percentage of the sighted students. This may be attributed to the primarily auditory manner in which visually impaired students learn and acquire information about the world around them.
Test 5, 6: 2D Spatial Ability Test
The sighted students fared better than the visually impaired students. There are multiple causes for these including lack of prior exposure to tactile images or exercises in a similar manner.
Test 7: Spatial Design Challenge
The sighted students performed slightly better(~15%). Here too the visually impaired students appeared under-confident in attempting the challenge due to lack of prior experience with the materials provided.
Observations
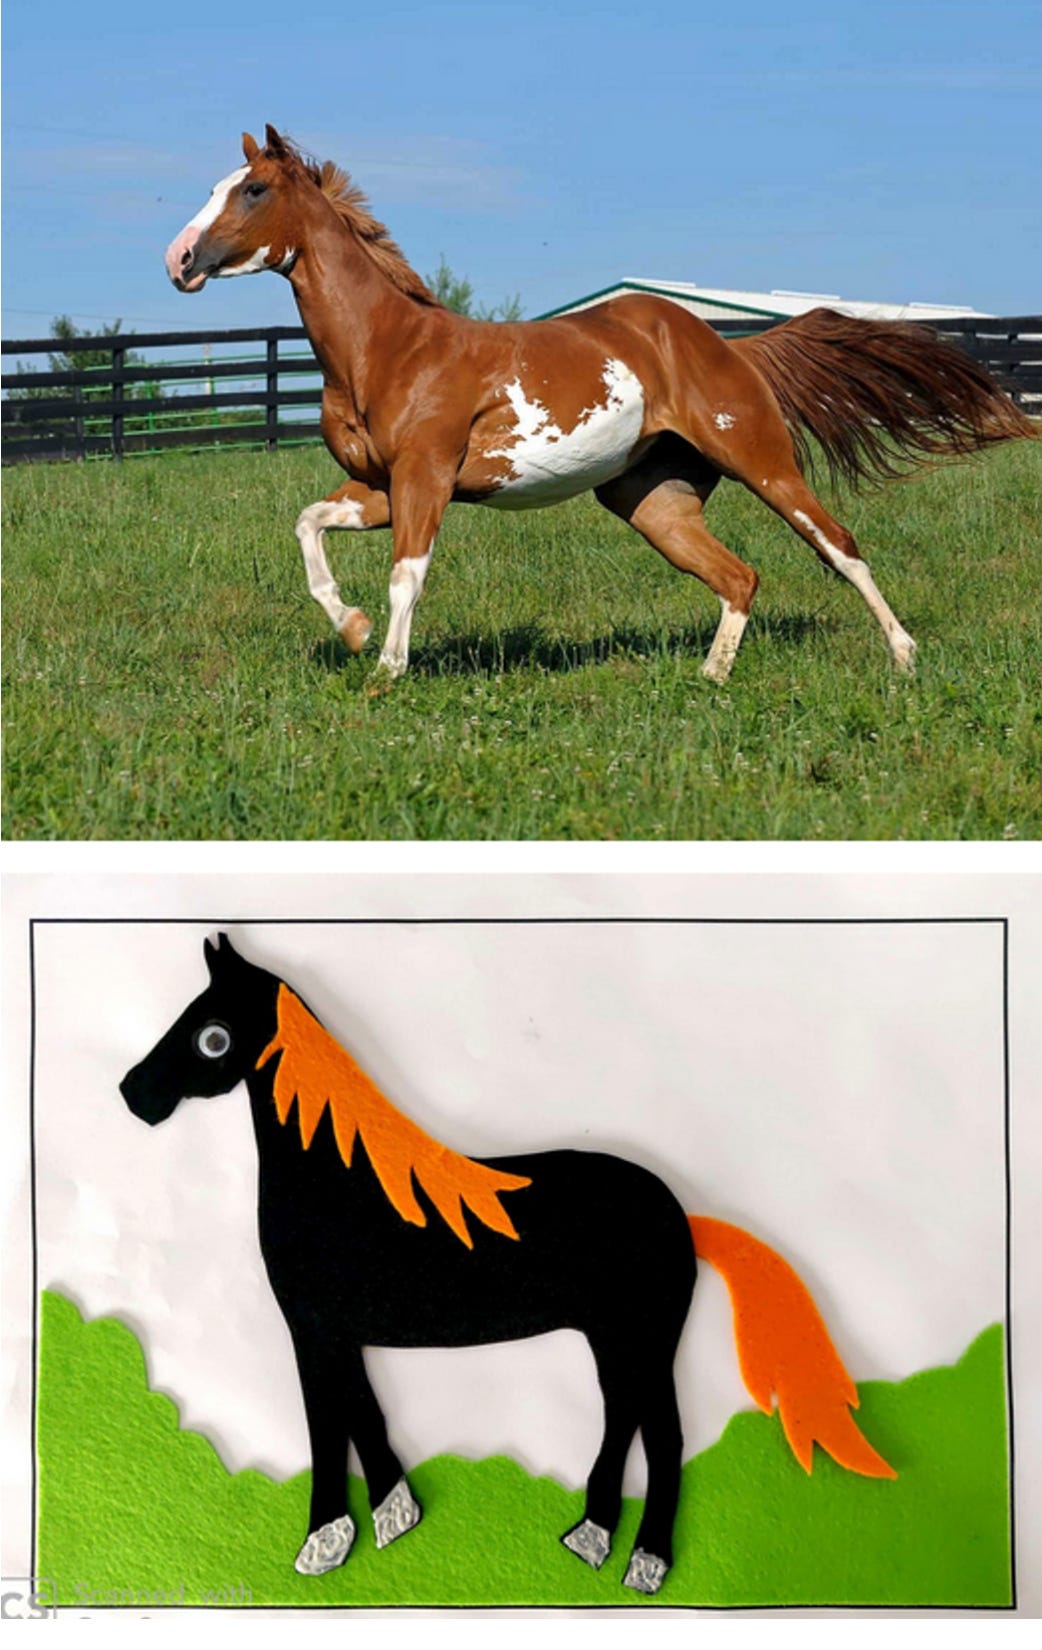
When asked the question “How does the mane of the horse look?”; of the 8 sighted children that gave a logical response, 4 of them described it using colours- brown, white, black etc. However the visually impaired students described its texture- using words like soft or smooth or like cloth.
In Test 2, the errors that visually impaired students make in replicating the math question in Braille to the Taylor frame reveals the need for an improved tactile math learning aid.
In Test 7 sighted children were able to pick up cues from the solutions of their peers. This necessary stimulus improved their designs considerably. However, VI children do not have access to this stimulus. A lot of learning from their peers and the environment can only be accessed if time and space are made for each VI student to explain his/her solution to his/her peers. We had not predicted such an outcome and were unable to incorporate peer learning access into the testing process. It can however be a useful aspect for teachers who work with visually impaired students to consider. An observation from both studies is that the sighted students tended to actively discuss their test with their peers during the test. While the visually impaired students didn’t ask or seem curious about their peers or how they were doing or felt about the test. They were more focused on completing their own tasks. This may be due to a lack of group activities for students with visual impairment.
The tests revealed multiple areas of opportunity for education for the visually impaired that should be prioritized and tackled to ensure a truly inclusive education for all students.
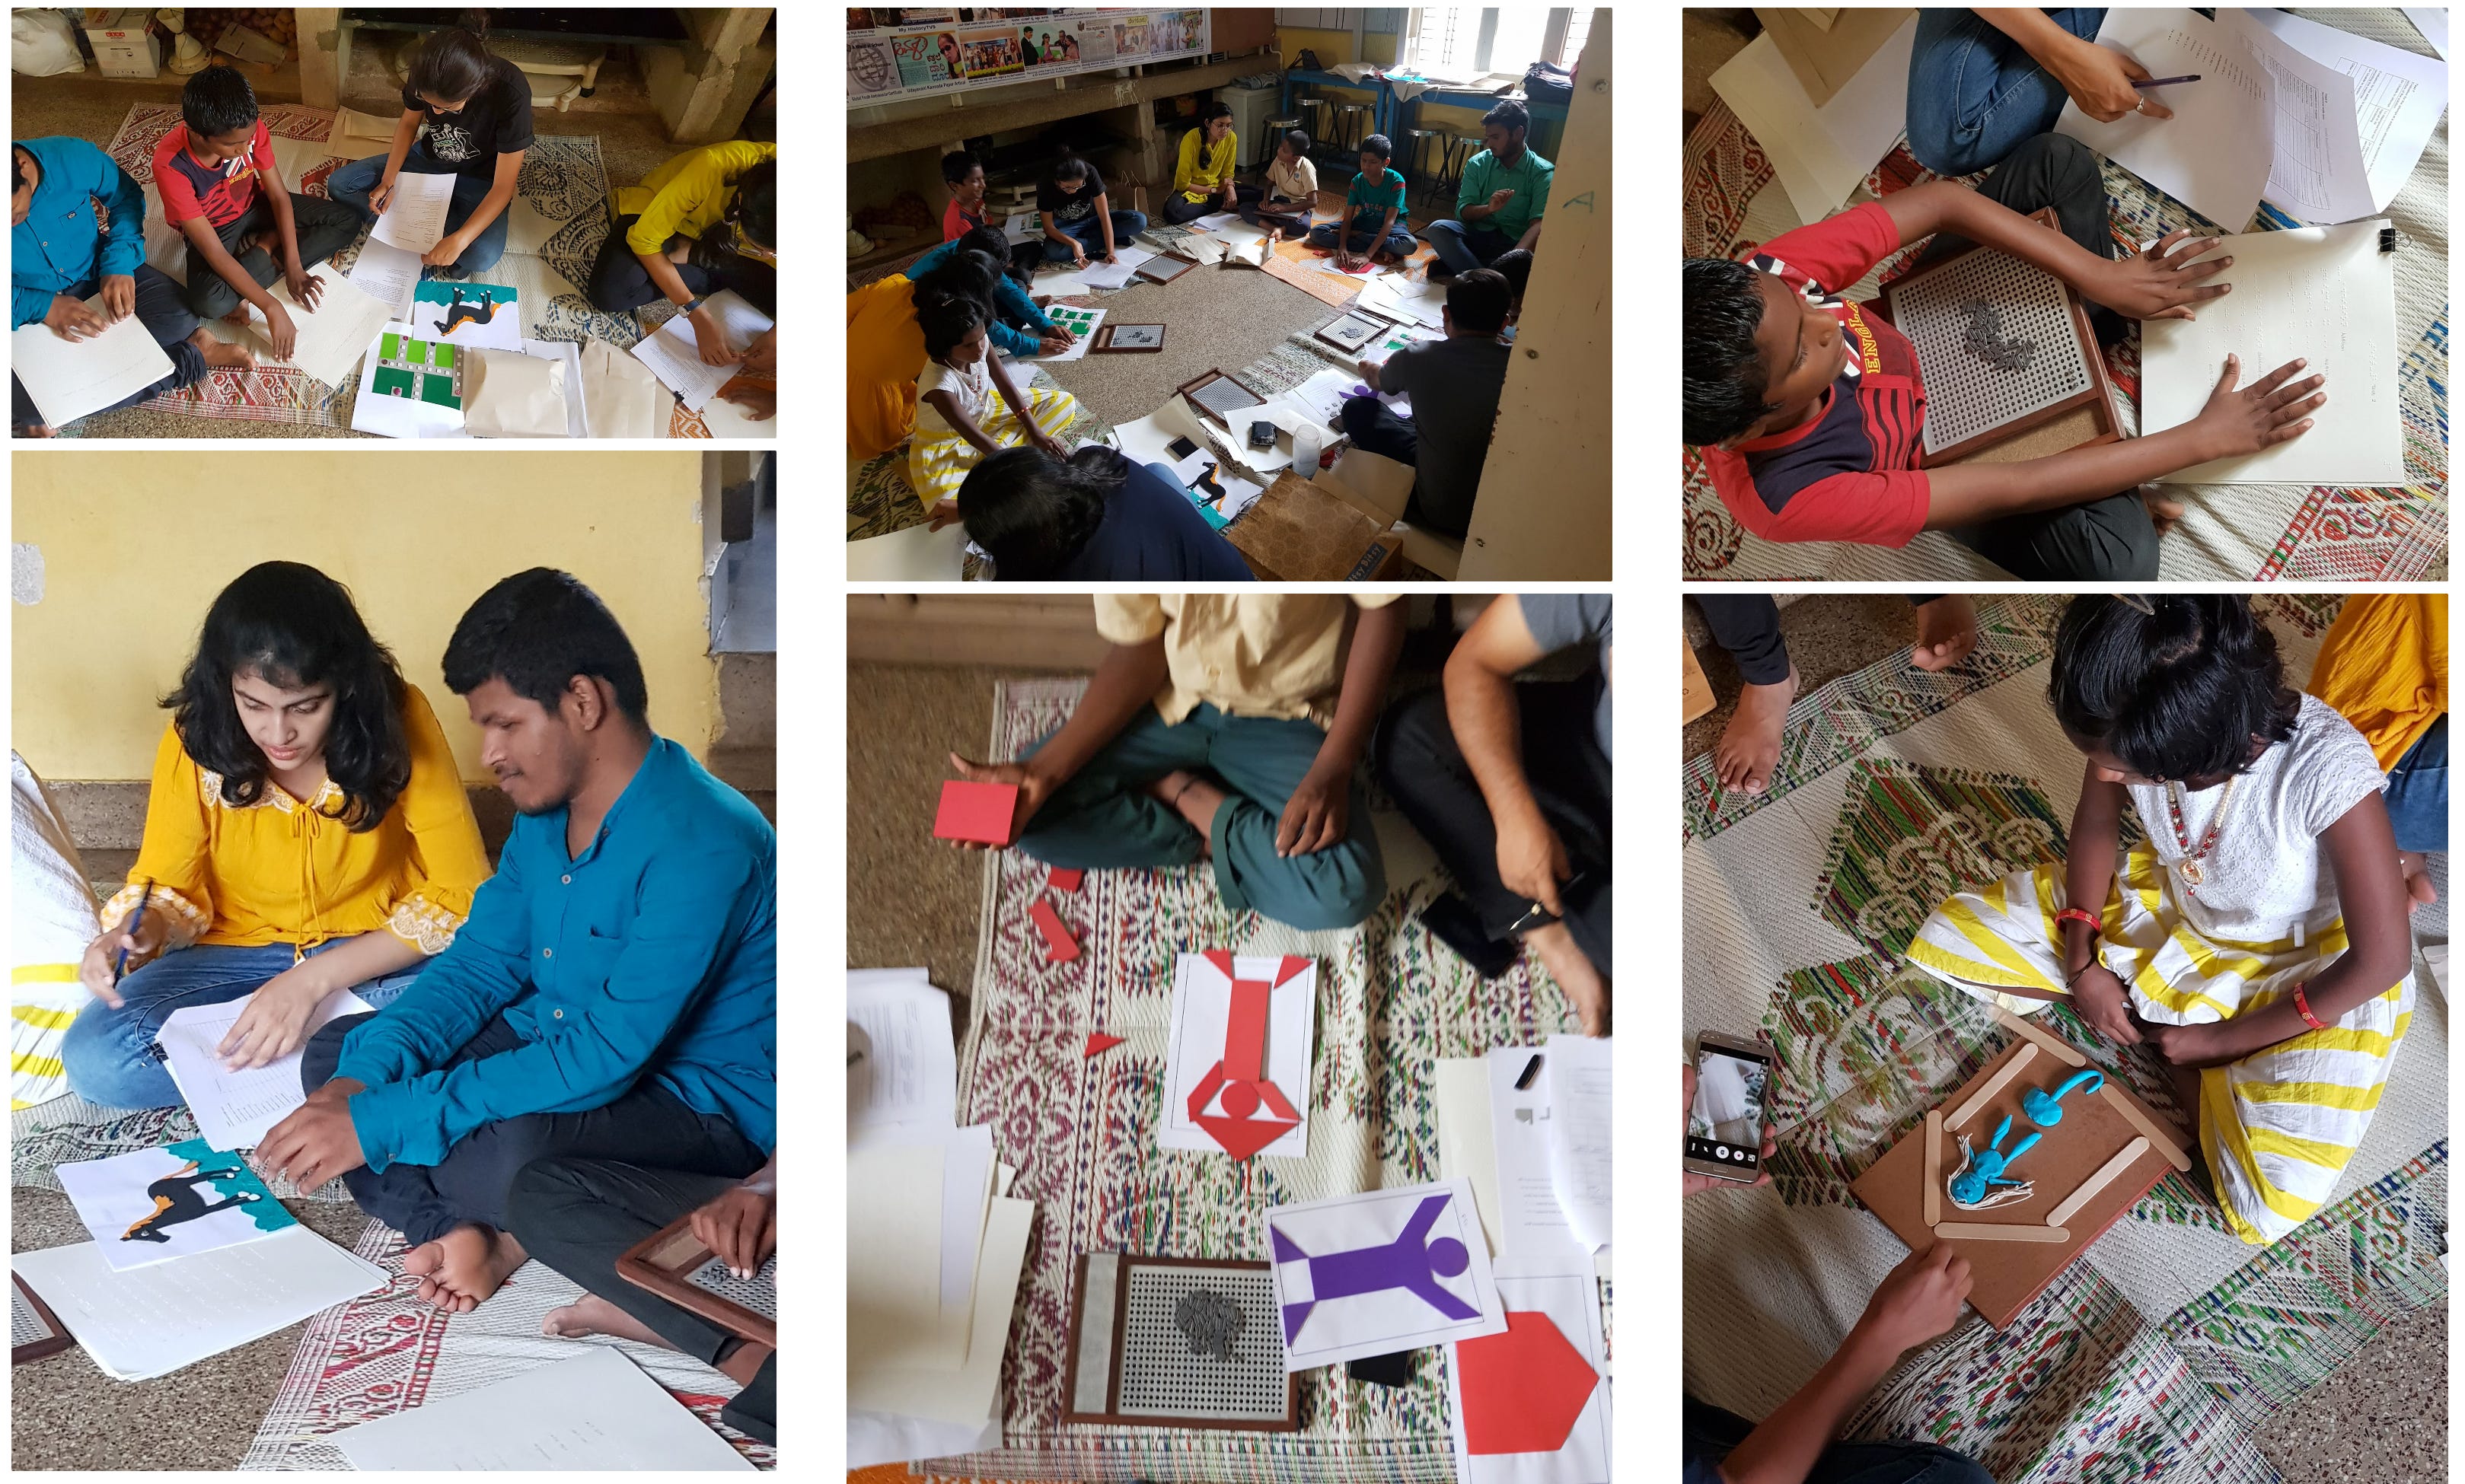
Gallery